This study aims to develop a generalizable approach to analyze the spatial distribution patterns of different types of retail and service businesses in a city. The analysis results provide business operators and real estate developers insights of how to choose the best location. The distribution pattern help urban planners better understand the spatial structure of the city and formulate appropriate zoning policies. The study was co-authored with Shiyu Sun and was published in IEEE International Smart Cities Conference.

Abstract:
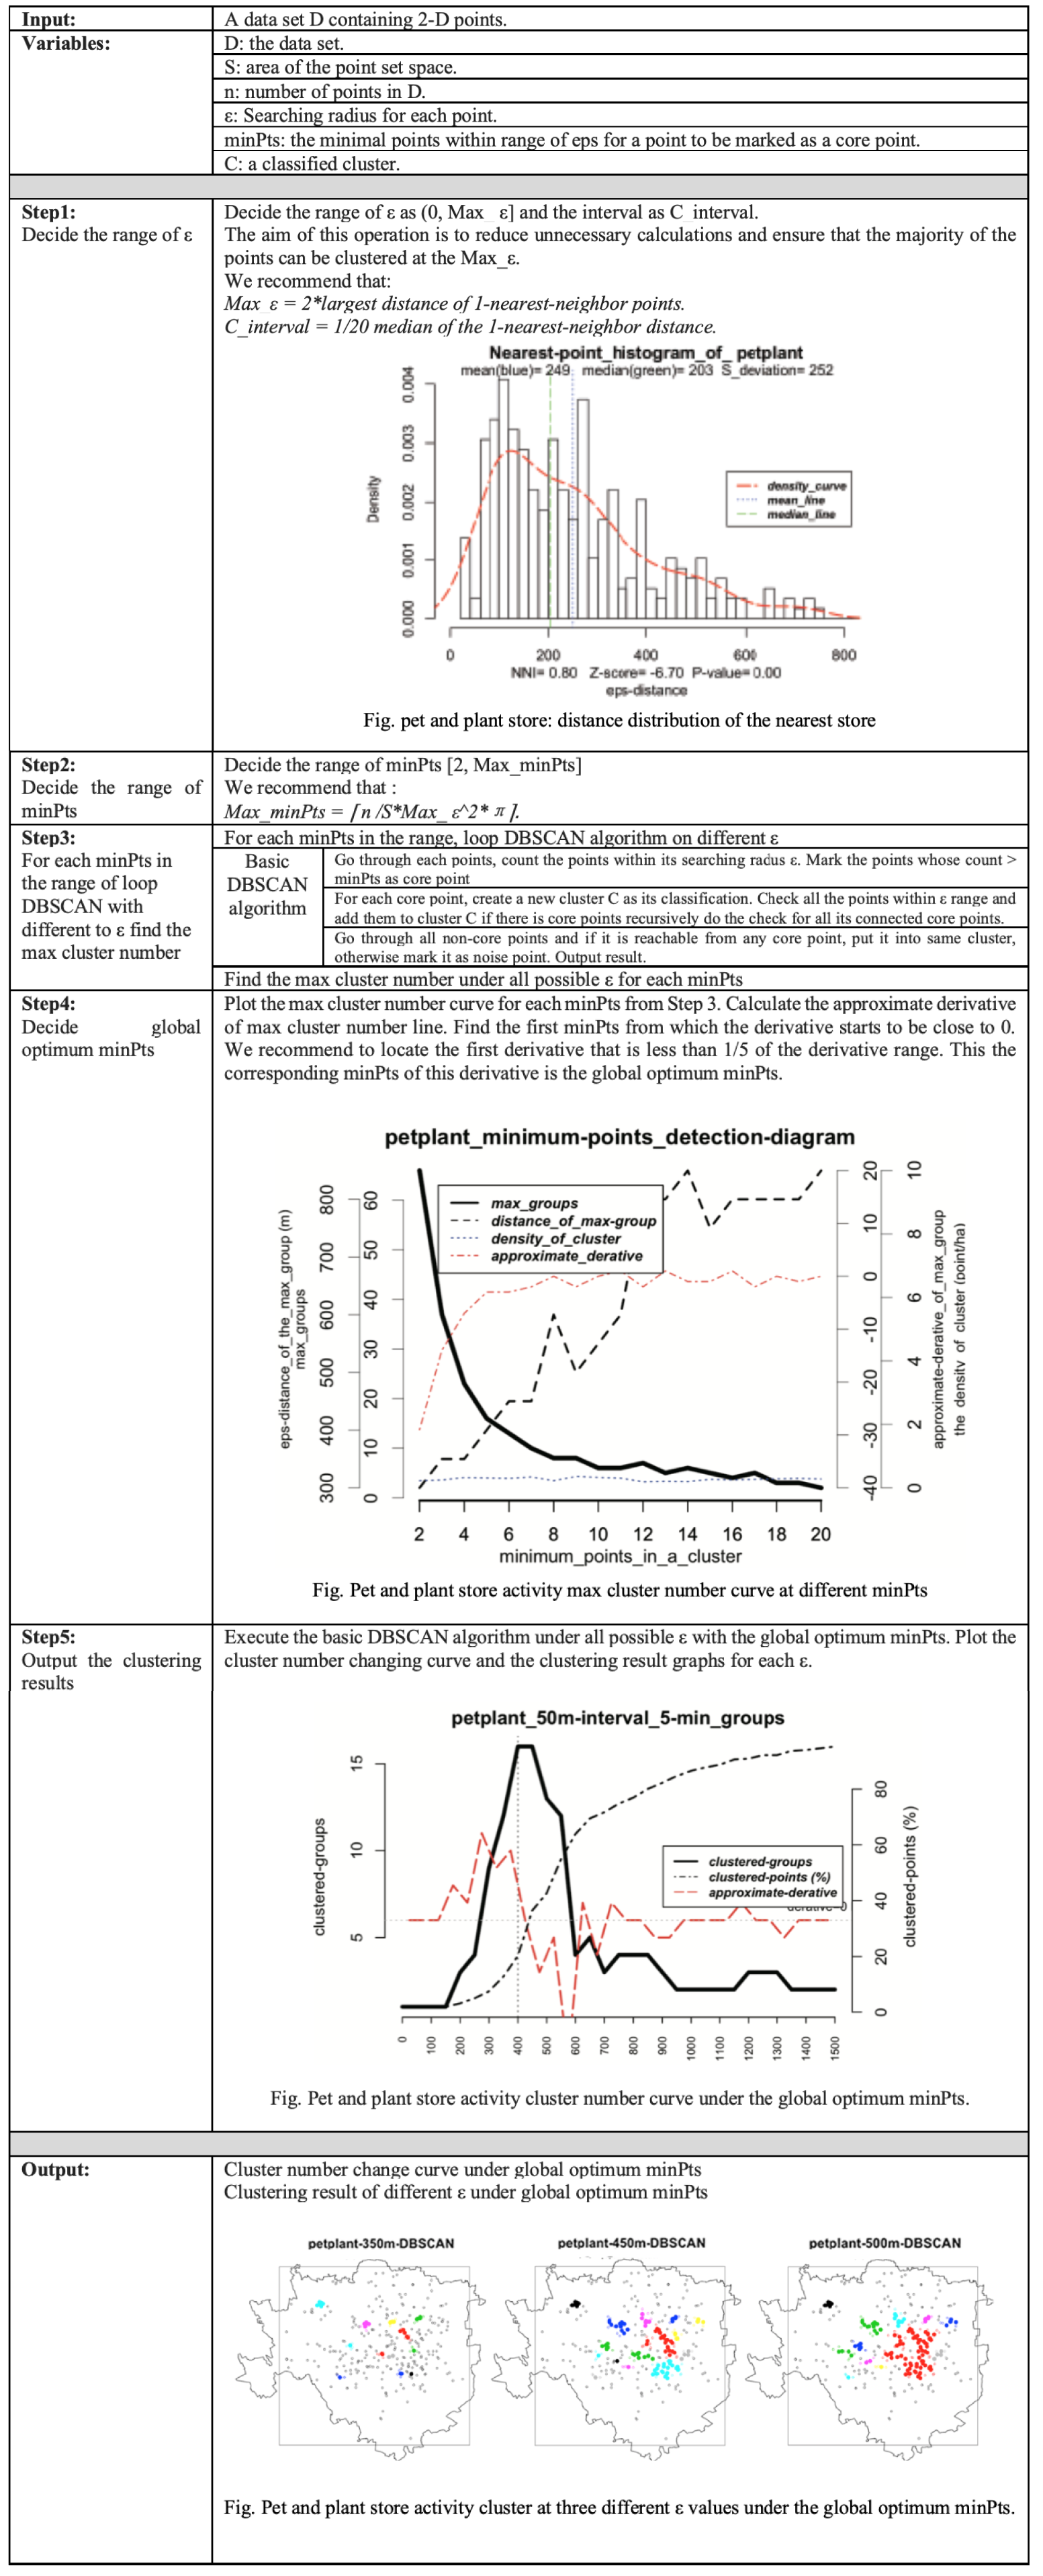
The main streets and commercial districts, where retails and services clusters locate, are the main spatial carrier for commercial activities in the city. For city planners and managers, a deep and clear understanding of how different commercial activities distribute in the city is the fundamental knowledge for making rational and promising planning and policies. Nowadays, the volunteered geographic information, such as Points of interest (POIs), provides urban researchers with a more complete and objective data source to analyze the spatial configuration of commercial clusters inside the city. Many studies tried this new source of data in visualizing and describing the commercial clusters of different activity types. However, although it is widely acknowledged that the observation of clusters depends on the observation scale, few of the studies pay attention to the scale of the commercial clusters inside the city. This study aims to analyze the cluster patterns of different commercial activities through multiple scales using a modified clustering algorithm based on Density-Based Spatial Clustering of Applications with Noise (DBSCAN) algorithm, Different from the original DBSCAN that needs input two parameters manually, the proposed DBSCAN is able to determine the global optimum minimum points (minPts) automatically by detecting the “elbow” of the maximum cluster groups curve through pairs of epsilon (ε) and minPts. And, with the global optimum minPts fixed, the modified DBSCAN could further select multiple local optimum ε, where the commercial activities form stable clusters at corresponding scales. Milan is taken as a case study city to demonstrate the usage of this proposed algorithm. 149234 POIs from the Milan Bureau of Industry and Commerce and Google place service are collected and classified into 25 categories. The results from the clustering process with modified DBSCAN, show that: 1) commercial activities have five typical spatial patterns: center concentration pattern, ring around center pattern, high-density concentration pattern, disperse distribution pattern and hierarchical distribution pattern. 2) Bars and clothing stores have the highest cluster density, which is 2.7 POIs per hectare, while pharmacy and tabacchi activities have the lowest density. 3) Personal service and health service clusters in Milan have the smallest unit size around 3ha, the supermarkets and fuel stations have the largest unit size. 4) the spatial shapes of different activity cluster areas could be classified into linear-shaped, planner-shaped and mixed-shaped three categories.
Multi-scale clustering process with DBSCAN:
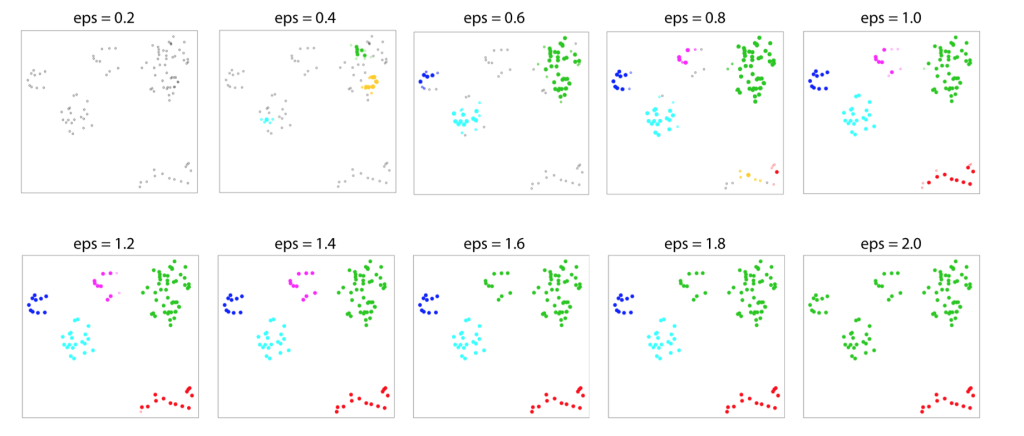
As the city commercial activities usually show different cluster characterizations at different scales, it is necessary to observe the activity cluster under different scales in order to find the optimum scale to describe the clusters of activities. The traditional DBSCAN is only able to detect clusters at given hyperparameters minPts and ε. minPts is the minimum points for the group of points to be considered as a cluster and ε decides the area of the unit searching circle. Thus, the ε actually represents the minimum cluster area or the minimum clustering scale. Taking a sample clustered point set as an example, we set the minPts = 5 and let ε be a series of numbers from 0.2 to 2 with an interval of 0.1. The cluster process is shown in the figure below.
In this study, a method is proposed to determine the global optimum minPts of DBSCAN automatically and then, with global optimum minPts, ε could be iterated continuously to search for the local optimum ε where points form stable clusters. This modified DBSCAN could not only aid researchers to quickly find the appropriate minPts and ε of a complex point set, but also enable the detection of clusters at different scales for a complex data set.
Cluster spatial pattern
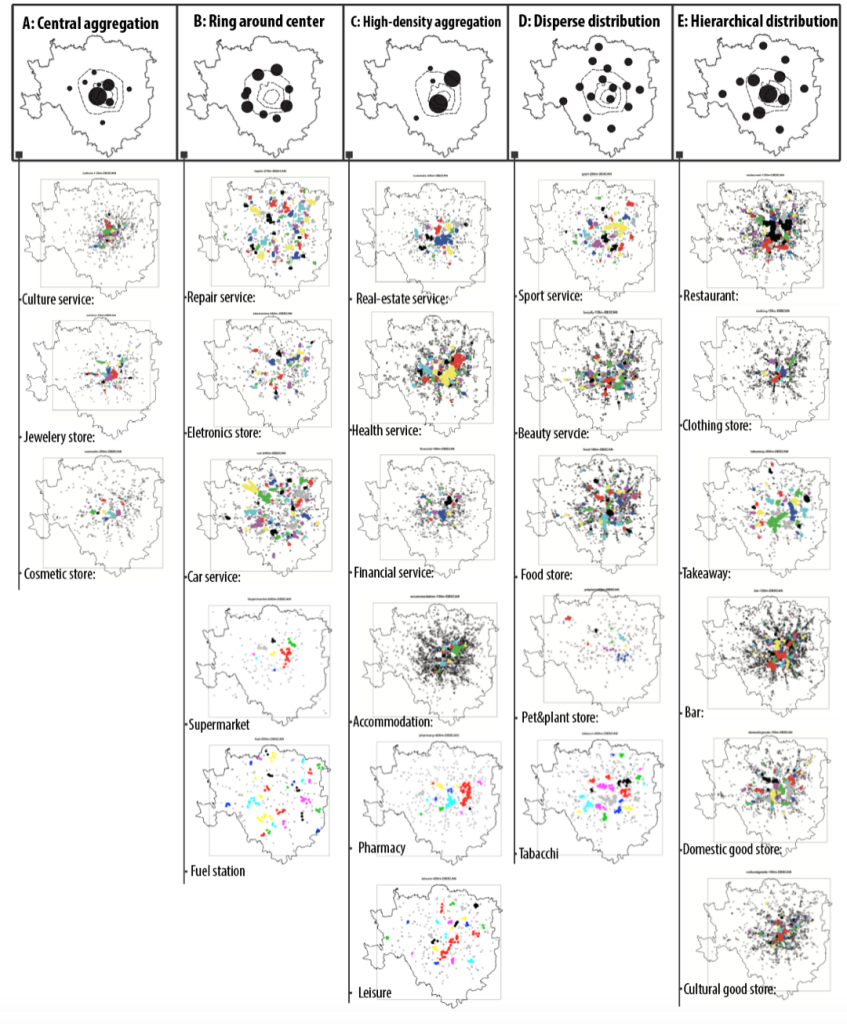
Different types of commercial activities not only differ greatly in the density, scale, and shape of clusters, but also show different patterns in the overall spatial structure. This study identifies the spatial location of clusters and summarizes five commercial cluster spatial structure patterns. (1) Central concentration pattern: The majority of the activities are clustered in the central area of Milan, such as culture-related activities, jewelry stores and so on. (2) Ring around the center pattern: Activities like electronic stores, car-related services are distributed around the inner ring or outer ring road in Milan. (3) High-density concentration pattern: the activities in this pattern are highly concentrated in a certain area of Milan, typically represented by financial services activities. (4) Disperse distribution pattern: the clusters of his commercial activity type spread all over the city and regularly distributed in Milan, such as sports facilities, food and drink shops, personal service, pet and plant shops. (5) Hierarchical distribution pattern: commercial activities in this pattern show an obvious hierarchical relationship in cluster size and center and sub-center clusters of commercial activities could be further identified according to the size of the clusters. Bars, clothing stores, restaurants belong to this type of pattern. Five commerical activity cluster spaital patterns in Milan.
– A: central concentration pattern;
– B: Ring around center pattern;
– C: High-density concentration pattern;
– D: Disperse distribution pattern;
– E: Hierarchical distribution pattern.
Cluster Size
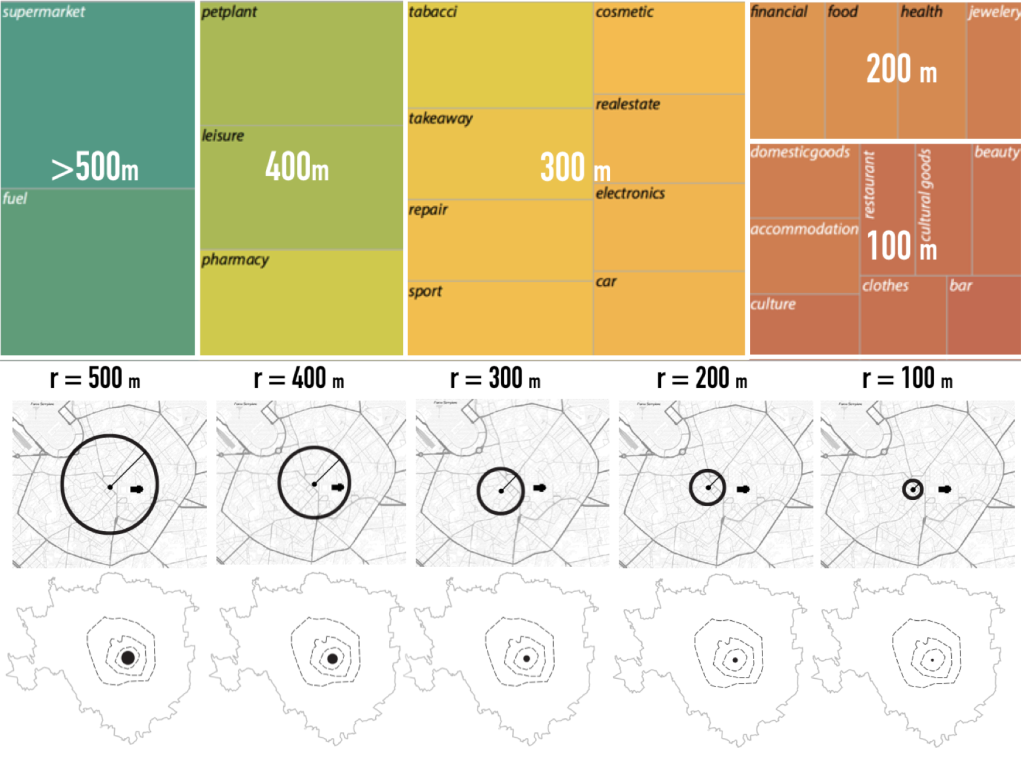
Different commercial types usually have different minimum local optimum ε, which means different types of activities cluster at different scales. The figure below shows the cluster size of different types commercial activity and the comparision between unit cluster size and Milan inner ring road.
Cluster density
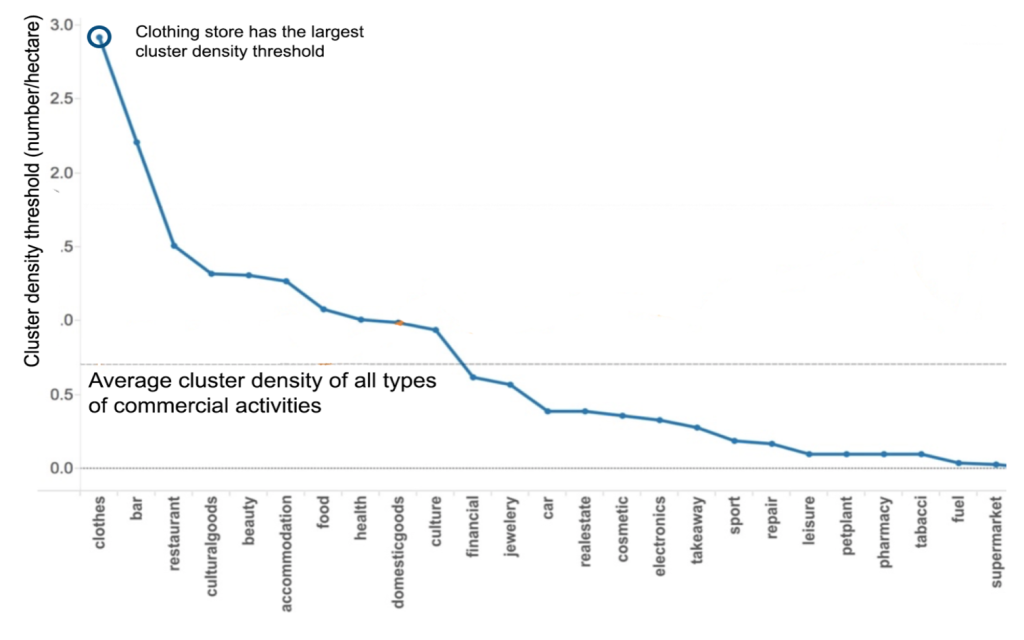
It can be found that the unit density of the clothing store cluster is the highest(around 3 stores per hectare), followed by the density of bars with 2.2 / hectare and restaurants with 1.5 / ha. The average threshold density of all commercial activities is 0.7 / ha. Leisure places, pet and plant shops, pharmacies and so on have the lowest density.
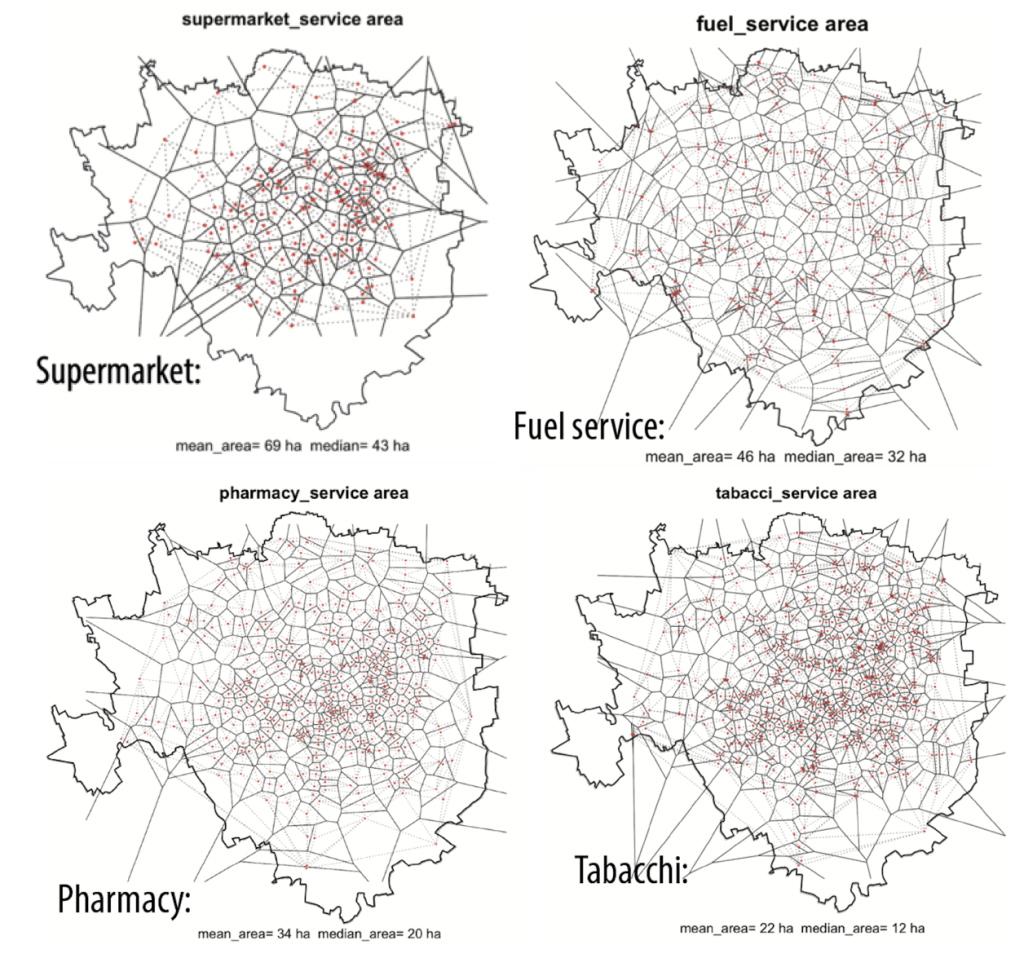
With the Voronoi diagram, we found activities of low cluster densities tend to be regularly distributed in Milan, which means that their functions are similar to the public services and serve people inside a fixed service radius.
Cluster shape
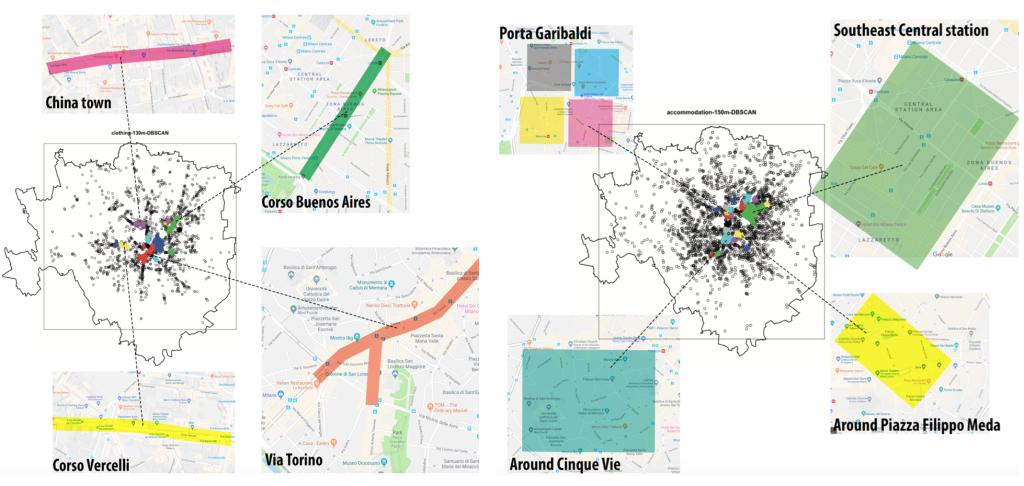
In addition to cluster scale and cluster density, through visualization of the clusters, it can be seen that different retail and service types have their own shape of patterns. A typical example is clothing stores in Milan, they usually extend along the streets, such as Corso Buenos Aires, Via Torino, and Corso Vercelli. On the contrary, some other activities are clustered in roughly square shape. For example, accommodations, like hotel and hostel, aggregate around Milan Central Railway Station, Cinque Vie and so on in square shape.
