This study was supervised by Prof.Zhiqiang Wu and collaborated by Lingyu Kong in 2016. The aim of this study is two fold: 1) develop an algorithm to monitor the growth of cities with satellite images at scale; 2) identify worldwide cities expanding patterns in the past 30 years.
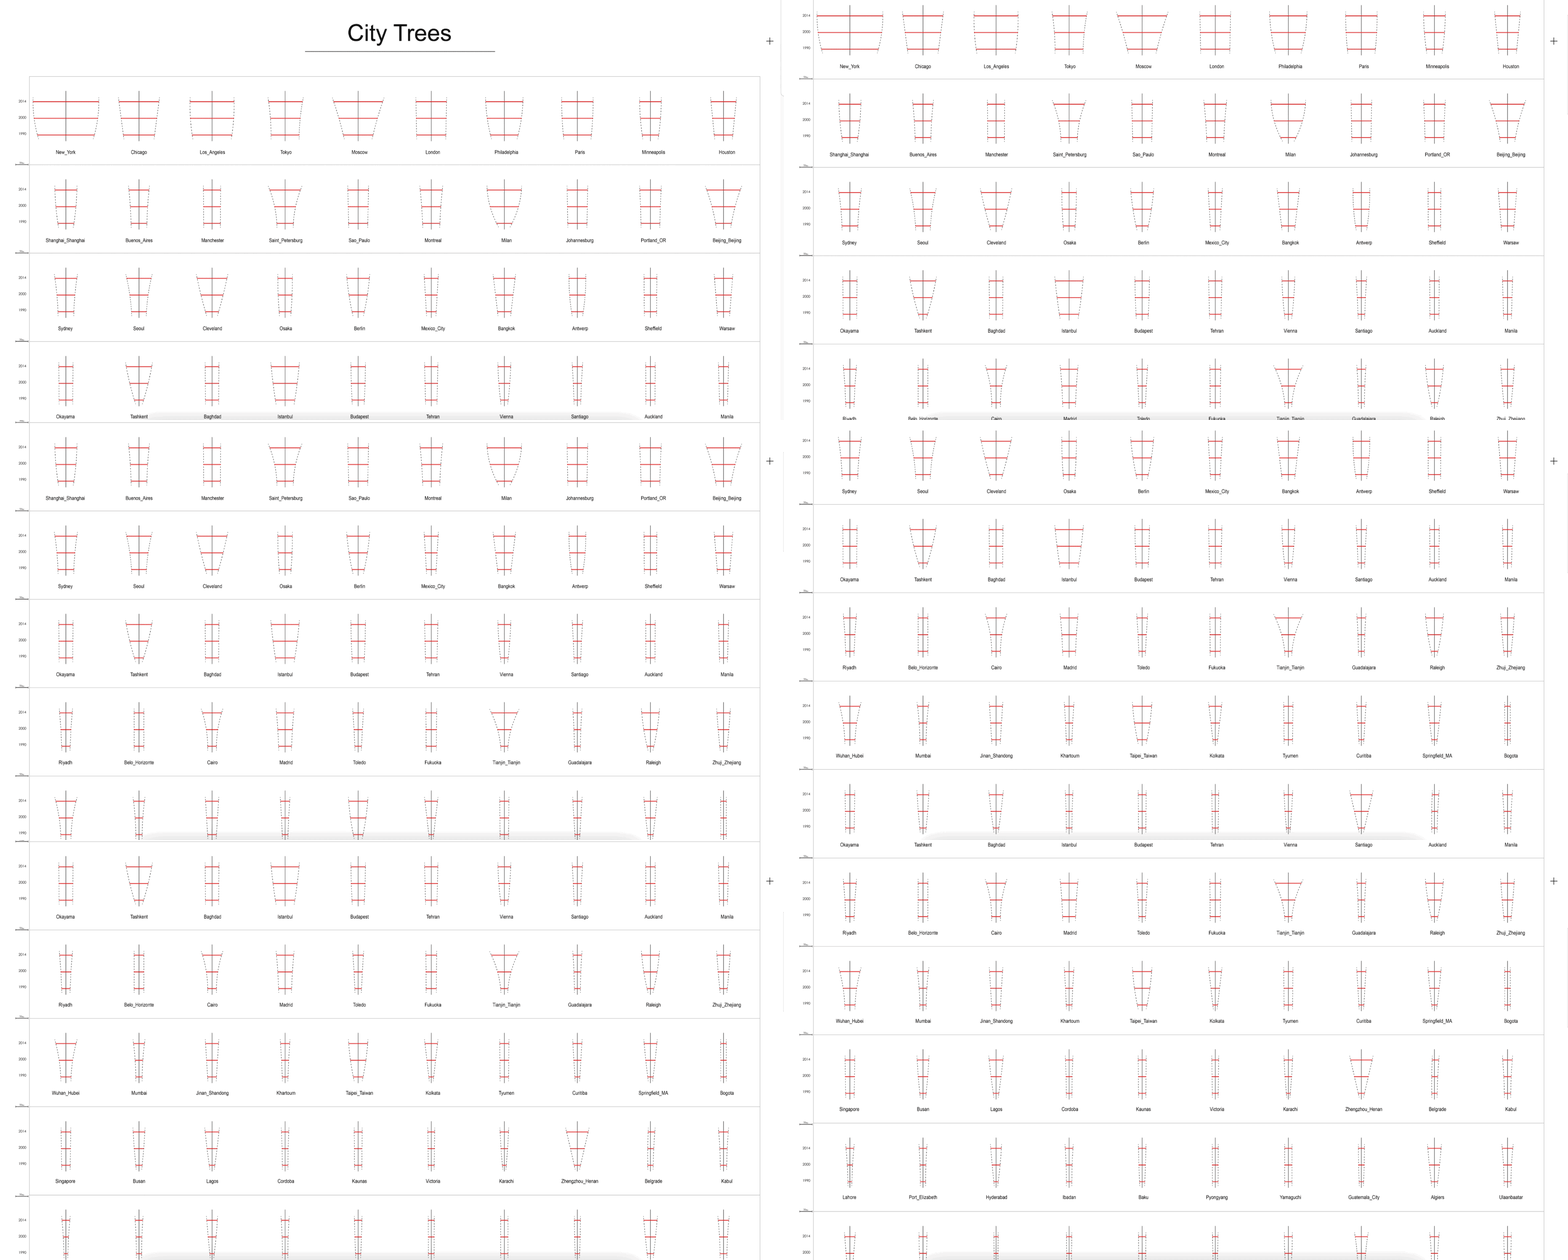
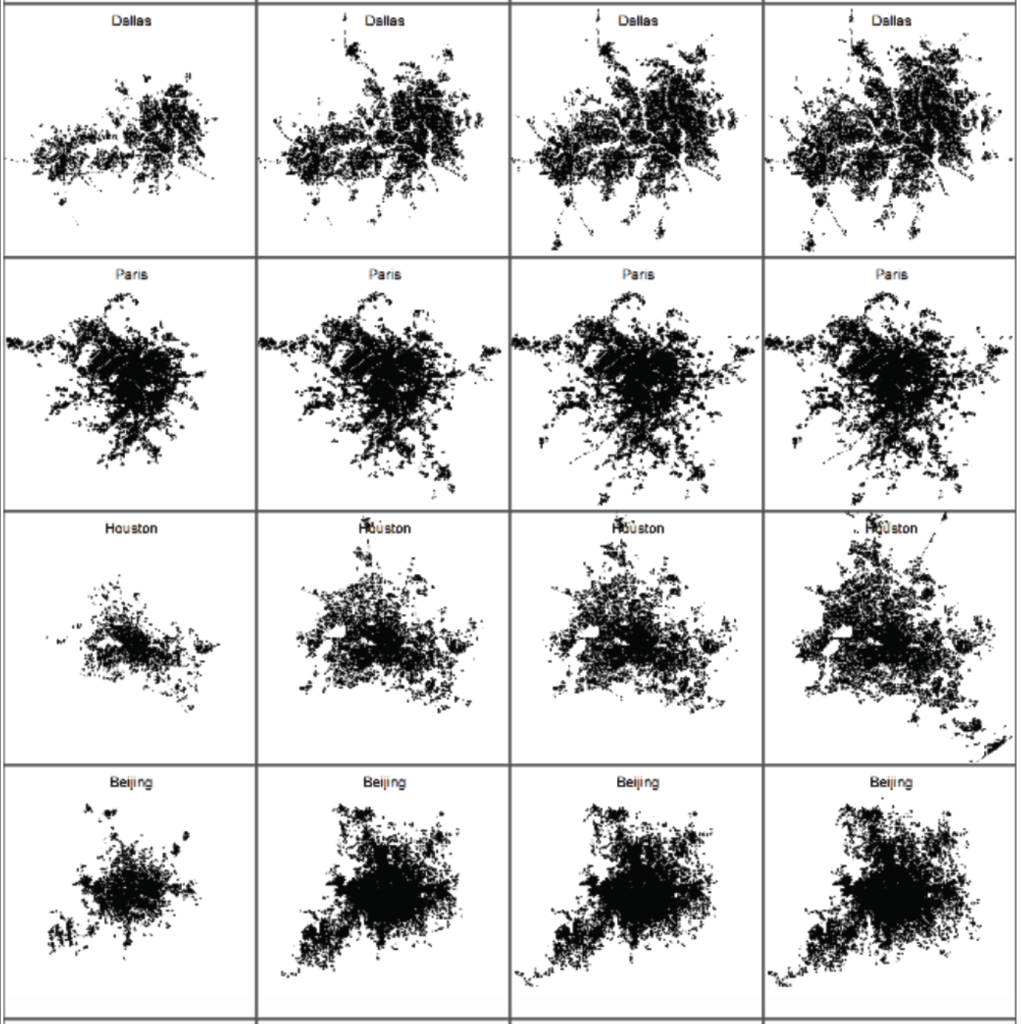
The control of urban boundaries is an important issue in China. In this study, we trained a classification model to distinguish the green planted land and built land through the supervised learning algorithms with satellite images. Then a city boundary is fitted to separate the green land and the built land based on the recognized land use type. The model is applied to detect the boundaries of 200 cities across world in 1980, 2000 and 2014. The figure below shows the built land in the city area.

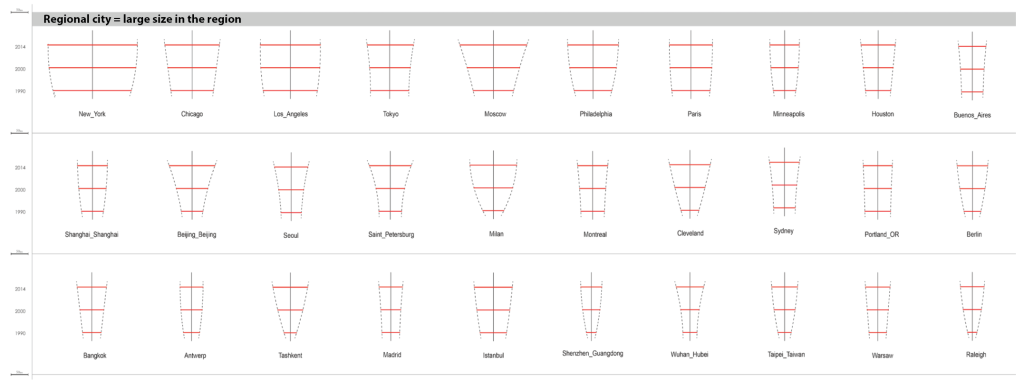
The fitted urban growth boundaries are sorted according to the size of the urban area in 2014. The fastest growing direction of the city is found and sections are plotted in this direction. On the basis of three sections, the growth trends are fitted with logistic regression model. The growing boundaries could also be visualized in 3D, as is shown in the right figure below.
Regional center city:
Cities in this type excess 1000km2 and are usually considered as the center of the cluster of cities and towns in the region.
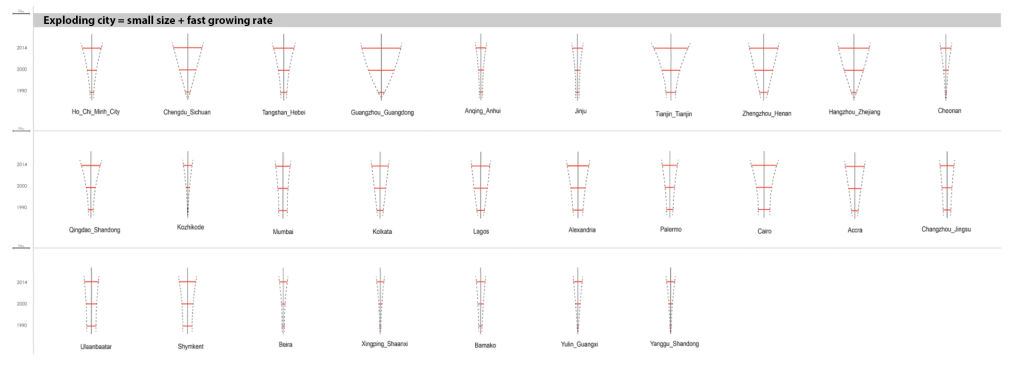
Exploding city: In this type of city, the area is quite small 40 years before, but the area and population exploded in the past 40 years. The growing trends continue without any sign of slowing down.
Developing city: The sizes of this type of city are larger than 300km2 in 2014, and still show gradual expansion trends
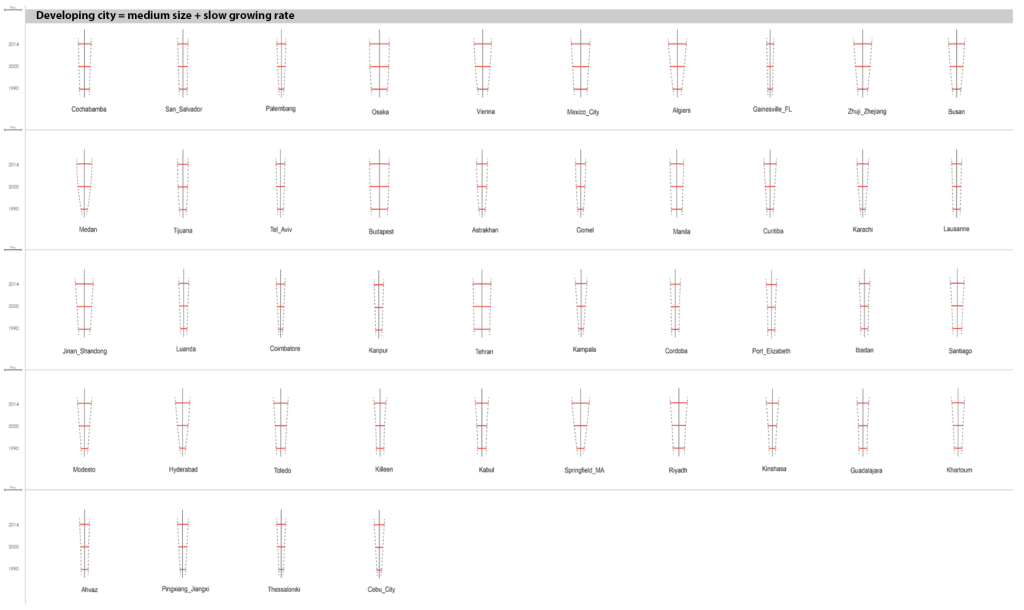
Stable city: The size of the cities are usually larger than 300km2 and remain stable in the past 40 years.

Baby city: In terms of the city size, the baby cities were probably just born around 1980 and sprouted gradually in the past 40 years.
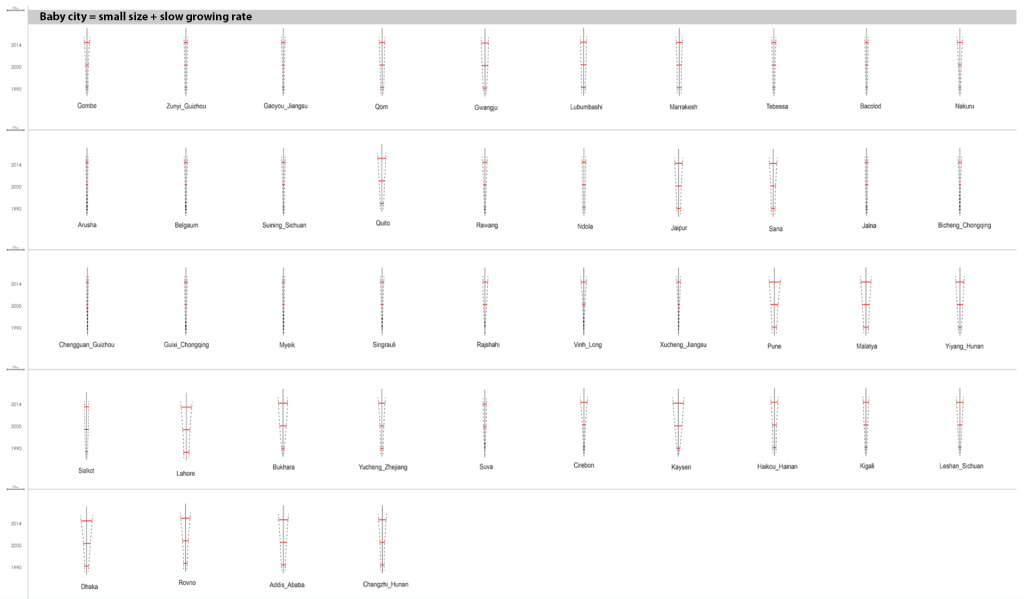
Maldevelopment cities: Cities of this category have extremely small sizes and don’t show any evidence of growth in the past 40 years.
