In the previous study, by using the hierarchical agglomerative algorithm, 150000 commercial-activity-related POIs in the 200m*200m grid are classified into 16 patterns in Milan. We further trained a static prediction model with 17 related urban factors to predict the 16 land use patterns. Taking the metro line 4 as an example, by comparing the new results with the old results obtained with the old indicators, we could forecast the possible changes of commercial space types after the construction of Line 4.
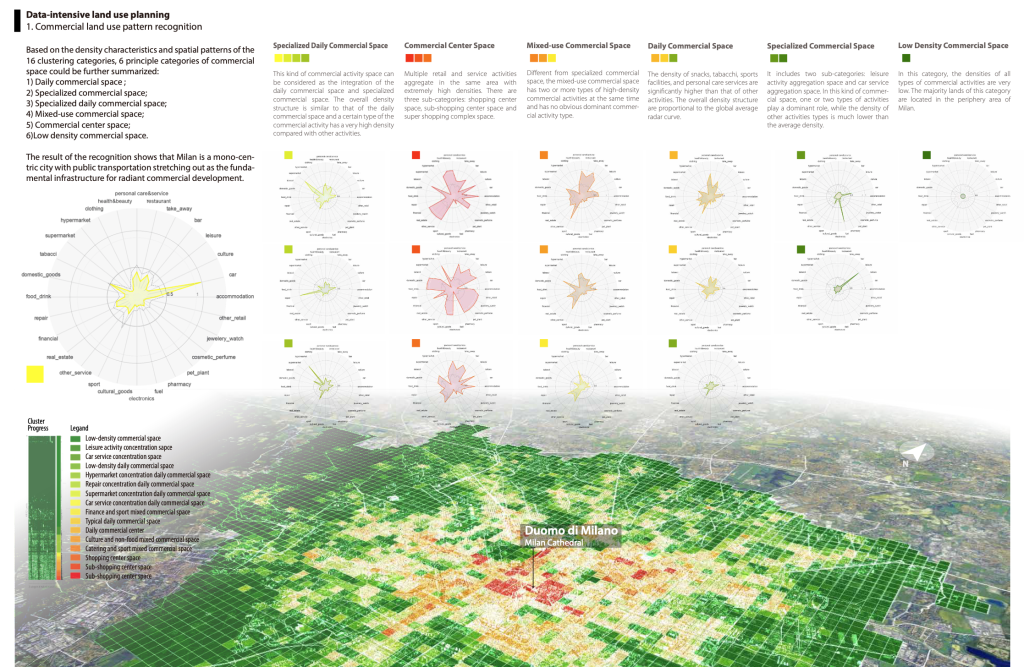
16 Commercial land use types in Milan
Based on the density characteristics and spatial patterns of the 16 clustering categories, 6 principle categories of commercial space could be further summarized:
1) Daily commercial space ;
2) Specialized commercial space;
3) Specialized daily commercial space; 4) Mixed-use commercial space;
5) Commercial center space;
6)Low density commercial space.

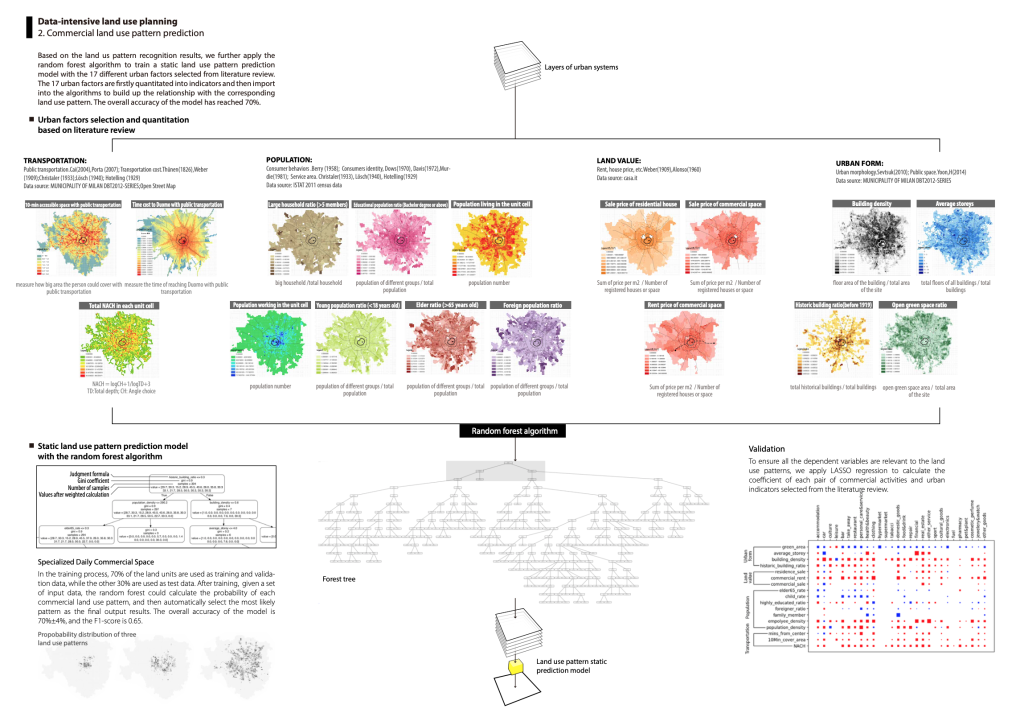
Collect land-use related factors and train the model with machine learning algorithm
Based on the land us pattern recognition results, we further apply the random forest algorithm to train a static land use pattern prediction model with the 17 different urban factors selected from literature review. The 17 urban factors are firstly quantitated into indicators and then import into the algorithms to build up the relationship with the corresponding land use pattern. The overall accuracy of the model has reached 70%.

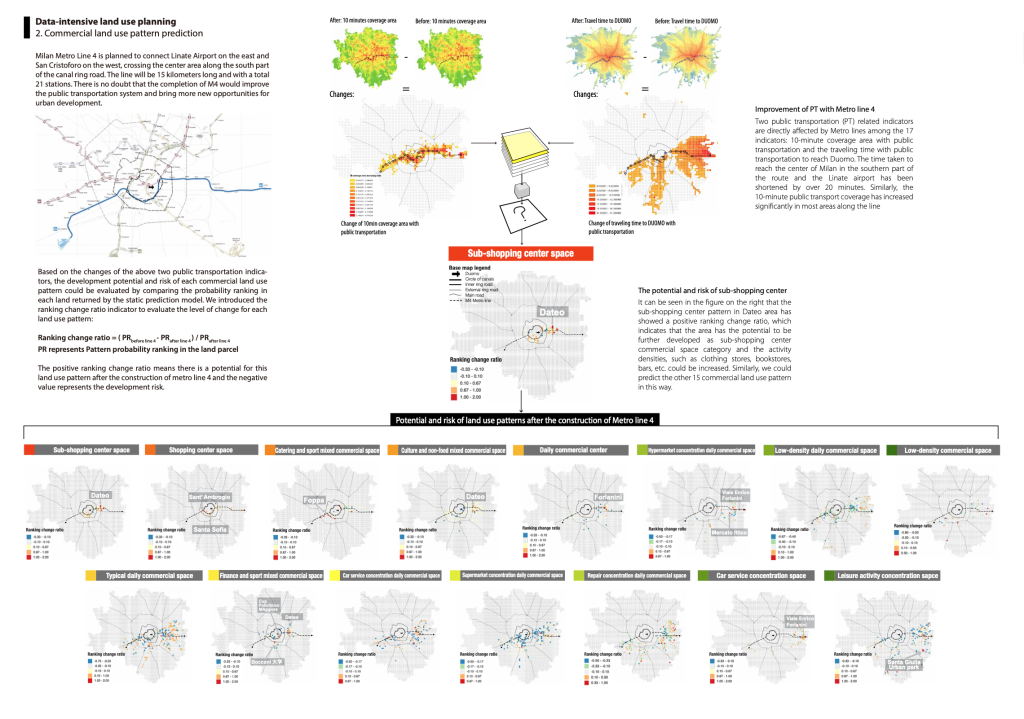
Update the mobility factors and predict potential land use changes
Milan Metro Line 4 is planned to connect Linate Airport on the east and San Cristoforo on the west, crossing the center area along the south part of the canal ring road. The line will be 15 kilometers long and with a total 21 stations. There is no doubt that the completion of M4 would improve the public transportation system and bring more new opportunities for urban development. Based on the changes of the two public transportation-related indicators, the development potential and risk of each commercial land use pattern could be evaluated by comparing the probability ranking in each land returned by the static prediction model. The small Milan maps below show how the land use types change with the new Metro Line 4.
