This study was based on the group project of Energy Planning studio at POLIMI in 2017. The paper was presented in the annual conference of 2018 Association of European Schools of Planning at Gothenburg. The group project was collaborated with Giada Marino, Mustafa Sherif and Leo Magat. The study was coauthored with Yiqiu Wu.

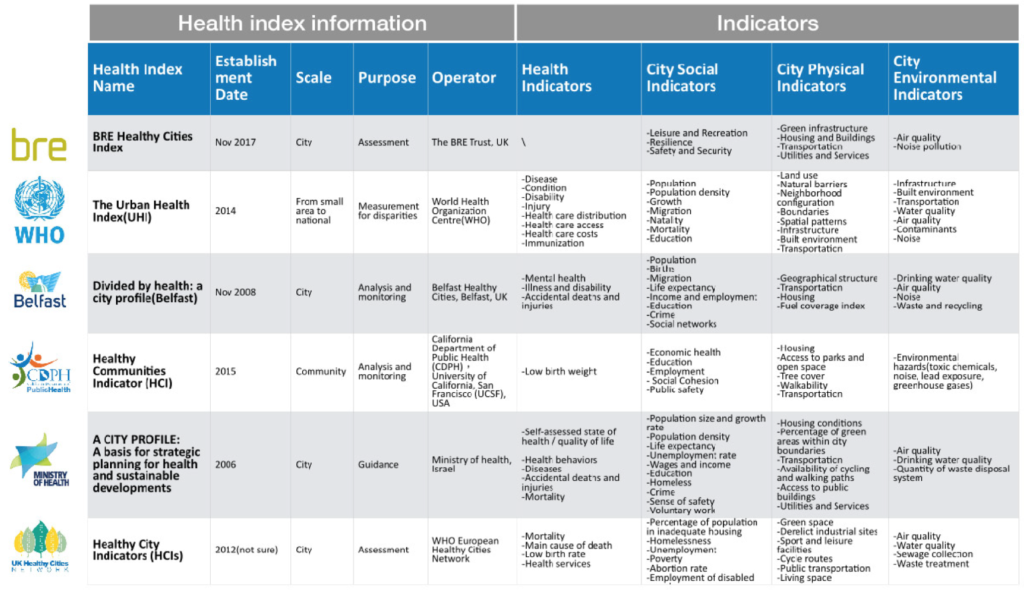
Healthy city has become a hot topic in urban planning in the past ten years. Not only government planning agencies have launched more projects or planning about healthy city, but also many organizations and institutions have developed a variety kind of health indicators and indices to compare the level of health among cities or countries. In recent years, with the development of data science, new data mining and computing technologies have been introduced in the process of collection and analysis of urban health indicators and in the methods of amalgamation.
As we have a close look at these health indicators, we find that the existing indicator frameworks share some general similarities. 1) Majority of the health indicators are used for in the comparison of large-scale areas, like countries, regions or cities. As a result, these indicators tend to show the very general conclusion about health issues. 2)Most health indicators use the health-directly-related data, for instance mortality rate, average age, as the main factors in the criteria system, because primary purpose of comprehensive indicators is to rank the areas. Consequently, these indicators may not be able to reflect the real reasons behind rankings. 3) The social data plays a more important role in these indicators than spatial or physical data. It is partly because the spatial or physical aspect is more difficulty to build quantitative connections with health quality.

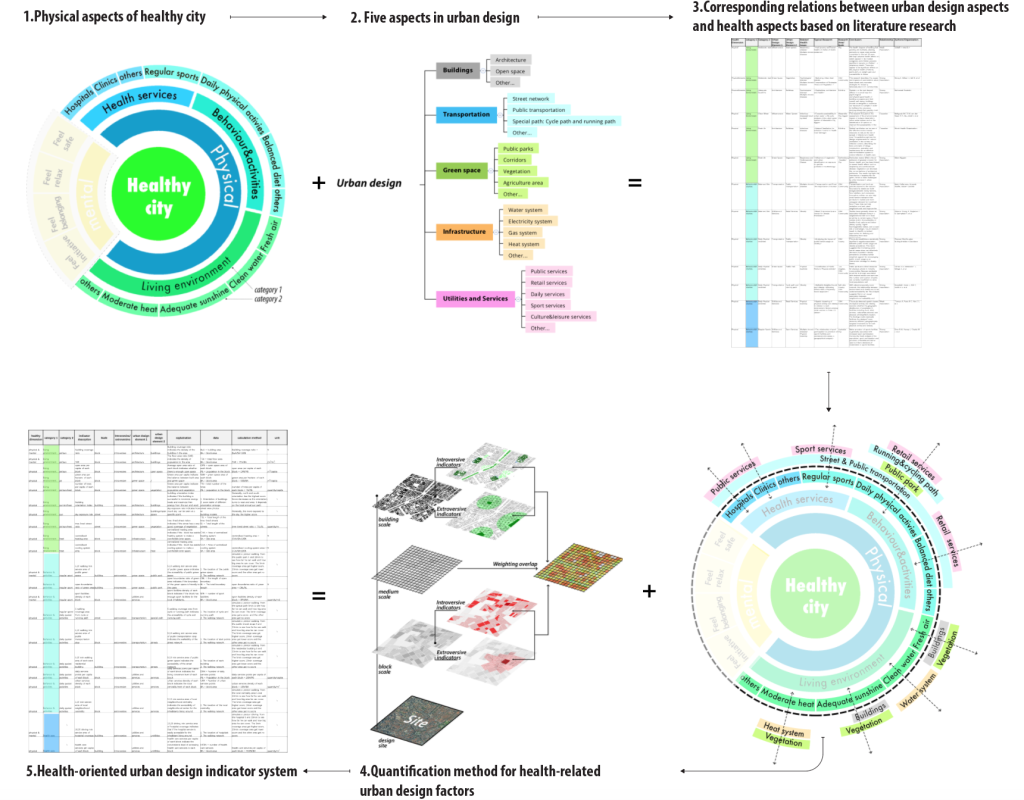
The assessment of large-scale areas is important for the strategy planning, while the detailed analysis of smaller scale areas is important for the practice of urban design. This article focuses on the indicator framework in the process of designing a health-oriented district by using multiple social and physical data. Different from the indicators for large-scale area, the indicators for small area focus more on spatial impacts on the lifestyles different groups of people live and emphasize the data and amalgamation method based on the specified local context and planning goals. In this article, we firstly collect typical researches about the relationship between health issues and urban environment. Based on these existing relationships, the article further manages to construct an indicator framework specified for urban design by combining the elements of urban design with health issues.

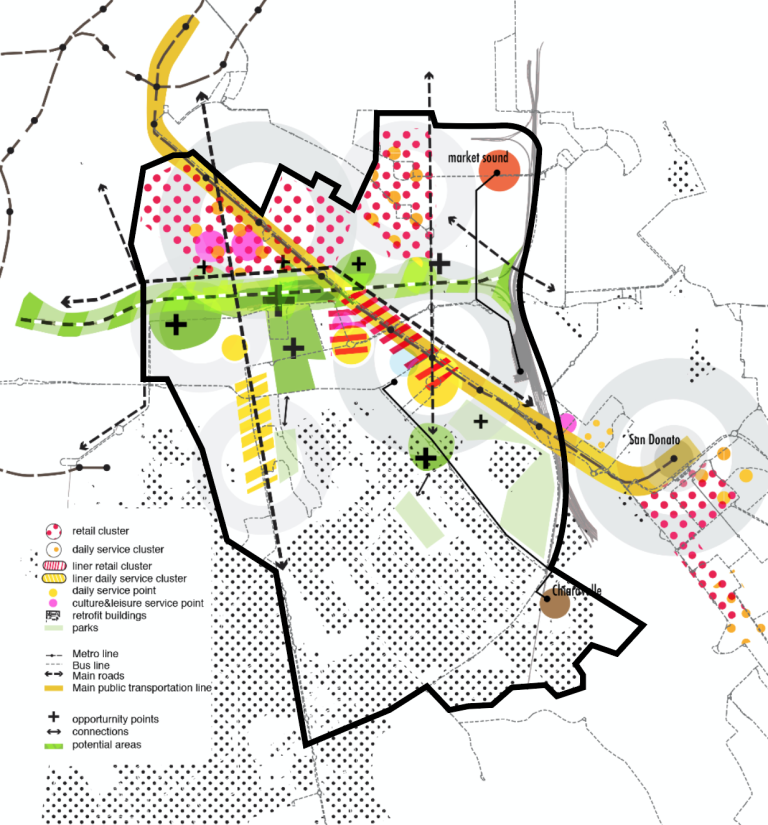
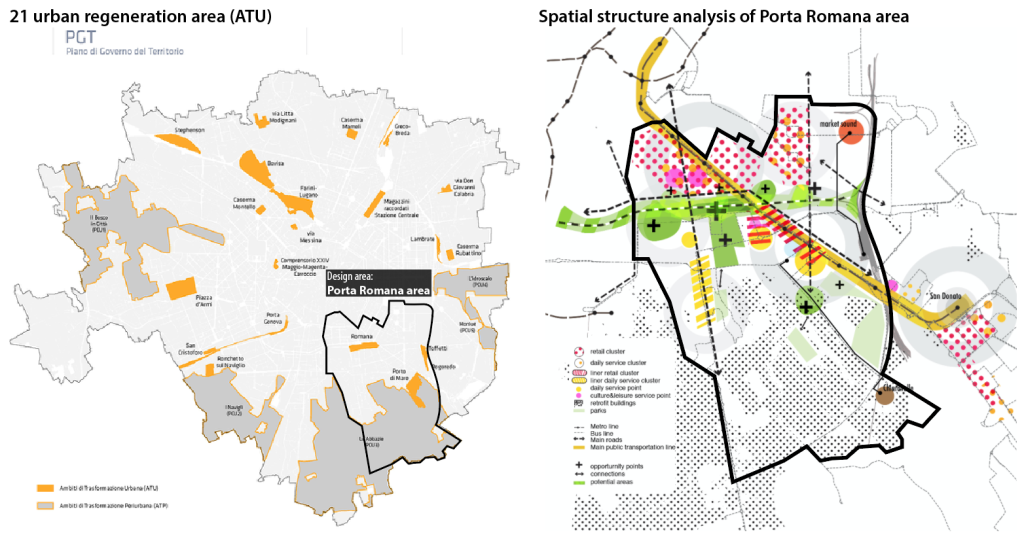
The practice of the health indicator framework is illustrated with the urban design process of Porta Romana area in Milan. The Porta Romana area locates in the south-east part of Milan. The area includes Porta Romana railway station and Porto di Mare park two urban transition zones (ATUs), which is identified as the focuses of urban regeneration by the municipality planning department of Milan (PGT)

The main goal of this project is to realize a more healthy environment that will attract more young people living here and create more leisure-related jobs in the area of Porta Romana. There are four aspects of goals, including healthy lifestyle and activities (people), healthy natural and built environment (environment), sustainable and healthy transportation system (mobility) and sustainable and efficient energy system (energy). The four general goals are followed with detailed strategies and actions based on the health-oriented urban design indicator system (HOUDIS).
Finally, all kinds of indicators are combined to get the overall indicators of healthy cities. A grid with 100*100m square grid is generated, and values of each indicator are added together to calculate the total score of each unit cell. As for the weight of each indicator, the environment indicators weights 40% of total, Behavior and activities indicators get 30% in total, transportation indicators get 20% in total and the energy indicators get 10% in total. According to the normalization and weight, we add all 7 indicators together for every unit. As to the indicators we cannot get data, we use the same value for each unit. Then we get the overall health index for each unit.
